
14 Instagram Data Findings That Every Marketer Needs to Know

Instagram’s well-documented rise as a mobile-social platform has intrigued marketers for the last few years, but data showing what content works versus what doesn’t has been scant—until now, that is.
Simply Measured studied the Interbrand top 100 list on Instagram during the third quarter and pitted the stats against its 2012 and 2013 benchmarks for the same period. For example, the Seattle-based vendor examined these names in its research: MTV; Mercedes-Benz; H&M; Nike; Starbucks; BMW; Adidas; and Disney.
Below are 14 compelling, data-driven discoveries the company shared first with Adweek.
- Big players have gotten on board. During 2012 Q3, 54 of the Interbrand top 100 brands had Instagram accounts. By the third quarter this year, that number rose to 86.
- And they are active. Seventy-three percent of those 86 brands post at least one photo or video per week. Those posting at least once daily tripled year over year in Q3 with the total number jumping to 20.
- Audiences are blowing up. The number of top 100 brands with more than 10,000 followers grew by 34 year over year in Q3 and now total 62 companies. And the number of brands with greater than 100,000 followers grew from 15 to 34.
- The Swoosh leads. Fifteen of the brands have more than 1 million followers, with Nike leading the way at 7.3 million.
- Engagement has generally jumped. The average engagement rate—which tallies comments and likes together—per post rose 415 percent in Q3 2014 compared to the same period 2012. The top brands averaged 18,822 likes and comments. During Q3 2012, they averaged 3,648 engagements.
- Good posts have a long tail. The brands on the Interbrand list accrued an average of 216 comments, with 50 percent of them coming in the first six hours. While 75 percent of consumer comments were posted during the initial 48 hours, 10 percent of comments came after 13 days.
- But great posts often kick in a little later. The highest-performing images and videos peak late, with more than 50 percent of their comments arriving after 13 hours of being live.
- Brief copy is popular. The average caption is 138 characters long, but Simply Measured found no significant correlation between text length and engagement rate.
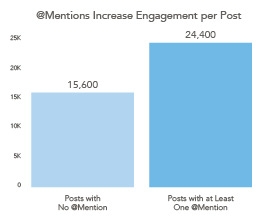
- Using @mentions helps big time. On average, posts that entail another user’s handle or @mention in the caption get 56 percent more engagement. But only 36 percent of brand posts involve at least one @mention.
- #brandposts don’t go overboard. Eighty-eight percent of posts studied included at least a single hashtag. Yet hashtags are usually few: 91 percent of posts have seven or less.
- Though, hashtags provide a boost. Posts with at least a single hashtag average 12.6 percent more engagement.
- Location, location, location. While just 5 percent of Instagram posts tag a location, the ones that do use this feature get 79 percent more engagement.
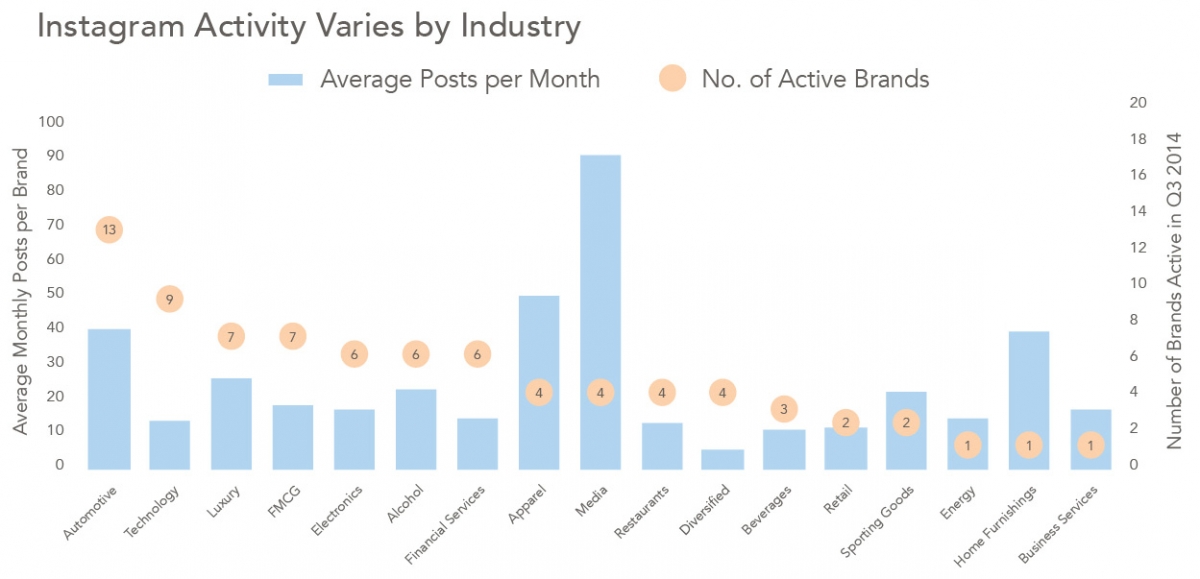
- Huge media brands are few, but killing it. Only four media firms from the Interbrand list are active on Instagram, but they average 62 percent more posts per month when compared with other niches in the study. They average 23,906 engagements per post, which adds up to 5,084 more likes and comments per post compared to other sectors.
- Carmakers are not shy on Instagram. The automotive industry has 13 Interbrand top 100 names on Instagram, beating all other categories.
And below are more category-based numbers from Simply Measured to chew on.
Reference: Adweek
-

Clutter Analysis
 Posted On May 11 2026
 -
TV Analysis Monthly Report April 2026
Posted On March 5 2026 -
PAS Hosts Pakistan Young Lions Competition 2026 for Young Marketing and Digital Talent
Posted On February 27 2026
-
TV Analysis Monthly Report May 2026
Posted On June 17 2026 -
Clutter Analysis
Posted On June 17 2026 -
TV Analysis Monthly Report June 2026
Posted On July 15 2026